(Figure: Bread and Honey) In the graph, a move from point a to point b costs: 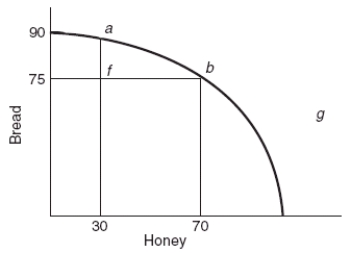
A) 70 jars of honey.
B) 75 loaves of bread.
C) 90 loaves of bread.
D) 15 loaves of bread.
Correct Answer:
Verified
Q105: If an economy faces increasing opportunity costs
Q122: (Figure: Bread and Honey) Which point in
Q123: (Figure: Bread and Honey) As more honey
Q126: (Table) According to the table, the
Q127: (Figure: Bread and Honey) In the graph,
Q129: Which shaped curve reflects the reality that
Q130: (Table: Production Possibilities Schedule) If the
Q180: A production possibilities frontier that is a
Q290: A production possibilities frontier will have a
Q338: If a producer does NOT face increasing
Unlock this Answer For Free Now!
View this answer and more for free by performing one of the following actions

Scan the QR code to install the App and get 2 free unlocks

Unlock quizzes for free by uploading documents