(Figure: Determining Curves) The curve in the graph represents a: 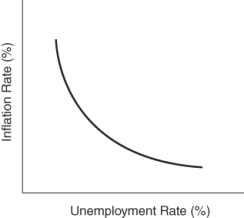
A) demand curve.
B) Phillips curve.
C) labor demand curve.
D) production possibilities curve.
Correct Answer:
Verified
Q1: One of the key factors leading to
Q7: The graph that shows the tradeoff between
Q42: The original Phillips curve showed a _
Q44: Which of these is(are) true? I. A
Q47: Which of these is(are) true? I. The
Q58: Which company did the Federal Reserve and
Q100: Assume that nominal wages increase 10% and
Q123: The United States underwent _ throughout most
Q168: Which of these was NOT a factor
Q212: The natural rate of unemployment is
A) the
Unlock this Answer For Free Now!
View this answer and more for free by performing one of the following actions

Scan the QR code to install the App and get 2 free unlocks

Unlock quizzes for free by uploading documents