(Figure: Laffer Curve) The graph shows a hypothetical Laffer curve. If the tax rate is 80%: 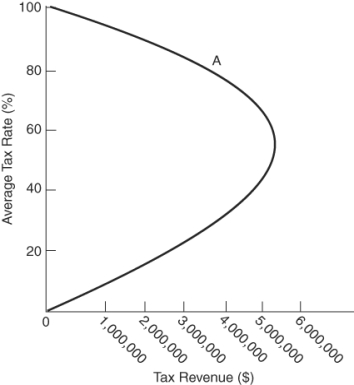
A) the government should reduce the rate to 50% to maximize tax revenue.
B) the tax rate should be increased to 100% (all income is taken in taxes) to maximize tax collection.
C) the tax rate is at its optimal level.
D) the tax rate should be reduced to zero to maximize tax revenue.
Correct Answer:
Verified
Q58: Reducing tax rates can _ aggregate demand
Q101: Which of the following is specifically designed
Q103: Which of the following regarding supply-side fiscal
Q104: Which of the following statements about fiscal
Q106: (Figure: Laffer Curve 3) A supply-side economist
Q110: The main idea behind supply-side economics is
Q201: The solution to the simultaneous presence of
Q237: The focus of supply-side fiscal policies is
Q295: _ is known for showing that a
Q327: Graphically, expansionary fiscal policy is displayed by
Unlock this Answer For Free Now!
View this answer and more for free by performing one of the following actions

Scan the QR code to install the App and get 2 free unlocks

Unlock quizzes for free by uploading documents