Which of the following graphs best depicts the impact of a policy that reduces the depreciation period for business equipment from five years to three years?
A) 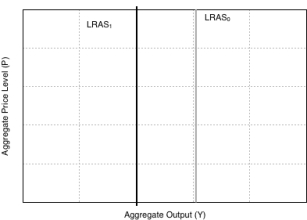
B) 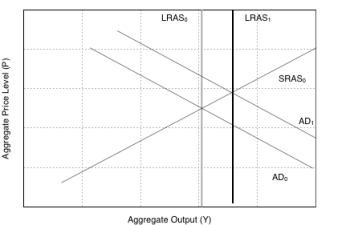
C) 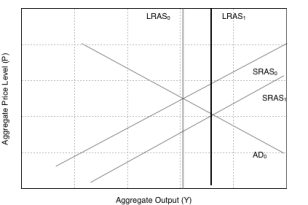
D) 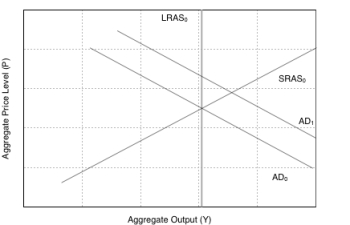
Correct Answer:
Verified
Q125: Which of the following is NOT involved
Q126: When a firm can _ its capital
Q128: When workers lose their job, they file
Q134: Which of the following groups must agree
Q135: Which of the following statements is (are)
Q147: According to the Laffer curve, what tax
Q166: The progressive income tax and transfer payments
Q173: The Laffer curve suggests that if tax
Q185: _ will automatically expand or contract in
Q239: Automatic stabilizers are designed so that as
Unlock this Answer For Free Now!
View this answer and more for free by performing one of the following actions

Scan the QR code to install the App and get 2 free unlocks

Unlock quizzes for free by uploading documents