(Figure: Graph Interpretation) In the graph, a negative relationship is depicted with a slope of -0.4. 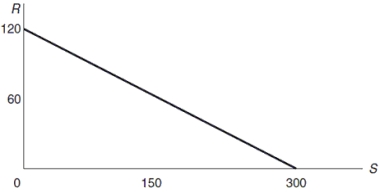
Correct Answer:
Verified
Q19: When two variables appear to be related
Q53: The height of the bars in a
Q66: Correlation between two variables is not enough
Q179: Simple graphs never provide information about the
Q185: Titles, labels for axes, and a statement
Q211: If variable S falls as variable X
Q233: In the equation C = a +
Q237: If two variables are correlated with one
Q266: Time series graphs include the value of
Q270: (Figure: Sales and Advertising) The graph shows
Unlock this Answer For Free Now!
View this answer and more for free by performing one of the following actions

Scan the QR code to install the App and get 2 free unlocks

Unlock quizzes for free by uploading documents