A) 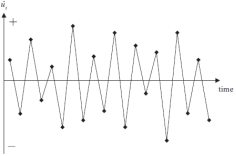 B)
B) 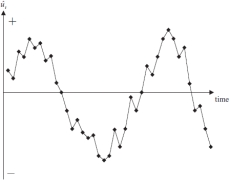
-The graphs above are time series plots of residuals from two separate regressions. Which of these combinations is true?
A) A shows negative autocorrelation and B shows positive autocorrelation
B) A shows positive autocorrelation and B shows negative autocorrelation
C) A shows heteroscasticity and B shows homoscedasticity
D) A shows homoscedasticity and B shows heteroscasticity
Correct Answer:
Verified
Q19: Which of these statements is true?
(I) The
Q20: A normal distribution has coefficients of skewness
Q21: Which of these is not a consequence
Q22: Which of the following statements are true
Q23: Which of these is a viable solution
Q24: Assuming a researcher runs the following regression
Q25: Simultaneous equations bias is a situation where
A)
Q27: Which of these is a test for
Q28: Assuming the researcher now runs the following
Q29: Which of these is not a viable
Unlock this Answer For Free Now!
View this answer and more for free by performing one of the following actions

Scan the QR code to install the App and get 2 free unlocks

Unlock quizzes for free by uploading documents