Each graph below shows the phenotype produced by three different genotypes in different environmental conditions (each line is a genotype). For each graph write "plasticity" or "no plasticity" depending on whether the graph depicts phenotypic plasticity. Also, write "G × E" or "no G × E" depending on whether the graph depicts a genotype by environment interaction. 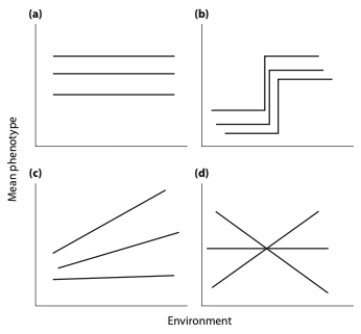
Correct Answer:
Verified
Q18: How does genome wide association (GWA) mapping
Q19: Which of the following statements about linkage
Q20: Below are some different scenarios for the
Q21: Which of the following scenarios best describes
Q22: If chromosomes were passed down unchanged from
Q24: Which response to different environmental conditions would
Q25: As a result of warming climate, most
Q26: If A1 represents an allele at
Q27: Given the graph below, and assuming that
Q28: What effect does each type of selection,
Unlock this Answer For Free Now!
View this answer and more for free by performing one of the following actions

Scan the QR code to install the App and get 2 free unlocks

Unlock quizzes for free by uploading documents