Examine the following Q-Q plot from the pre-test control group. What can be assumed from the graph? 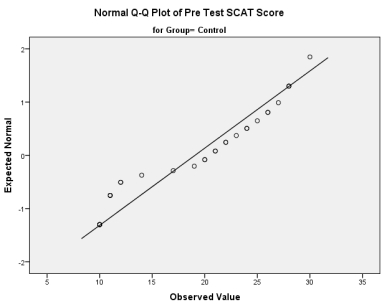
A) Data may not be normally distributed because the points deviate from the diagonal line.
B) Data are definitely not normally distributed because the points deviate from the diagonal line.
C) Data may be normally distributed because the points deviate from the diagonal line.
D) Data are definitely normally distributed because the points deviate from the diagonal line.
Correct Answer:
Verified
Q2: Analyse the group data by using a
Q4: Which of the following descriptions best explains
Q6: See the week 12 data in Q5
Q7: Which of the following are non-parametric tests?
A)
Q11: Suppose you were interested in the longer-term
Q12: Which test can be considered the non-parametric
Q15: Based on the answer to Q13, what
Q16: Based on the results of the initial
Q17: Suppose you wanted to see if there
Q20: Which is the correct expression for the
Unlock this Answer For Free Now!
View this answer and more for free by performing one of the following actions

Scan the QR code to install the App and get 2 free unlocks

Unlock quizzes for free by uploading documents