Examine the following Q-Q plot from the pre-test control group. What can be assumed from the graph? 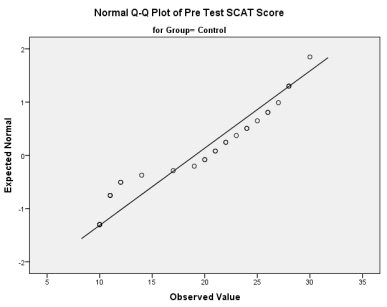
A) Data may not be normally distributed because the points deviate from the diagonal line.
B) Data are definitely not normally distributed because the points deviate from the diagonal line.
C) Data may be normally distributed because the points deviate from the diagonal line.
D) Data are definitely normally distributed because the points deviate from the diagonal line.
Correct Answer:
Verified
Q5: Calculate the effect size for the test
Q6: See the week 12 data in Q5
Q13: Run an appropriate test between the pre-test
Q17: Suppose you wanted to see if there
Q18: If we wanted to compare the control
Q19: Run an appropriate test between the pre-test
Q25: What is the parametric equivalent of a
Q35: View the anxiety data (Sport Competitive Anxiety
Q36: Since there are three sets of data,
Q45: What is the parametric equivalent of a
Unlock this Answer For Free Now!
View this answer and more for free by performing one of the following actions

Scan the QR code to install the App and get 2 free unlocks

Unlock quizzes for free by uploading documents