Plot resting diastolic blood pressure as a histogram. You should get the histogram below. How would you describe its appearance? 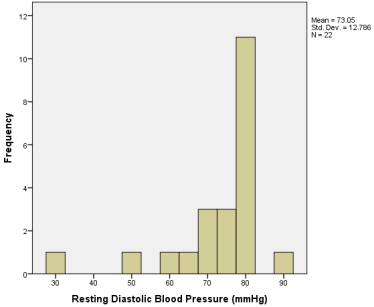
A) Normally distributed
B) Positively skewed
C) Negatively skewed
D) None of the descriptions represent the data expressed in the histogram
Correct Answer:
Verified
Q3: What assumption can be made regarding the
Q4: The z-score for the kurtosis or skewness
Q6: Split the data according to the sport.
Q7: Sources of bias can be reduced if
Q9: What is the correct expression for the
Q11: What does the X in Q1 refer
Q12: What does Levene's test do?
A) It tests
Q14: Calculate the z-score for the kurtosis of
Q18: Ignoring the sport played, run a Kolmogorov-Smirnov
Q23: Calculate the z-score for the skewness of
Unlock this Answer For Free Now!
View this answer and more for free by performing one of the following actions

Scan the QR code to install the App and get 2 free unlocks

Unlock quizzes for free by uploading documents