When analysing the result of the paired samples t-test, the output presents the following box, but what do the results show you? 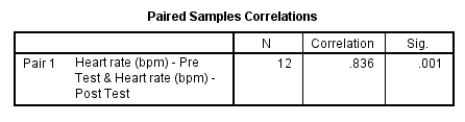
A) The correlation value between the two variables is strong, statistically significant and therefore correct to use.
B) The correlation value between the two variables is moderate, but not statistically significant and therefore should not have been used.
C) The correlation value between the two variables is weak and not statistically significant and therefore should not have been used.
D) The correlation value between the two variables is weak, but statistically significant and therefore correct to use.
Correct Answer:
Verified
Q1: Which of the following expressions best represents
Q2: What is the effect size for the
Q6: How might you classify the measurement scale
Q8: Assume that for the research into stomach
Q11: What is the correct result for the
Q12: Analyse the data below related to days
Q17: If a significance result of .000 is
Q18: Examine the following SPSS output from the
Q21: When analysing the cancer survival data, a
Q23: Which of the following statements best reflects
Unlock this Answer For Free Now!
View this answer and more for free by performing one of the following actions

Scan the QR code to install the App and get 2 free unlocks

Unlock quizzes for free by uploading documents