What is shown in the following graph? 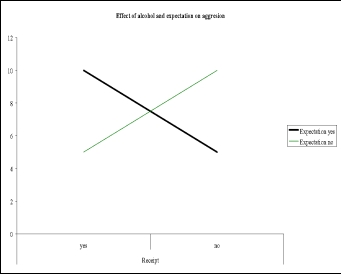
A) There is an interaction and no main effects.
B) There is one main effect and no interaction.
C) There are two main effects and no interaction.
D) There is an interaction and two main effects.
Correct Answer:
Verified
Q1: Breaking down a total variance is referred
Q3: Why is Levene's test a useful test
Q8: Which of the following is not a
Q12: Factorial ANOVA for the maintenance sector is
Q16: Using the data in the table below,
Q20: The histogram shown below relates to a
Q21: A study undertaken by an unknown author
Q22: A study undertaken by an unknown author
Q24: What is an interaction effect?
A) Where the
Q25: When cell means for subgroups are examined,
Unlock this Answer For Free Now!
View this answer and more for free by performing one of the following actions

Scan the QR code to install the App and get 2 free unlocks

Unlock quizzes for free by uploading documents