The following figure shows the impact of technological change on the marginal cost of producing a certain good.Producing Q* units with the new technology reduces total cost by an amount equal to ________. 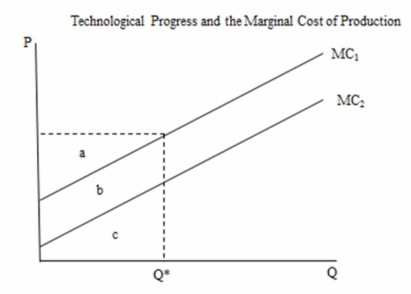
A) area a
B) area b
C) area c
D) areas a + b
Correct Answer:
Verified
Q12: Opportunity cost _.
A) is represented by the
Q15: The marginal cost curve is affected by
Q15: In the following figure the marginal cost
Q18: The following figure shows the impact of
Q19: The benefits a consumer acquires from consuming
Q23: Total costs are found by _.
A) the
Q24: The marginal cost curve of a firm
Q26: One important characteristic of all marginal cost
Q28: Refer to Table 3.0. What is the
Q32: Technological progress _.
A) results in a downward
Unlock this Answer For Free Now!
View this answer and more for free by performing one of the following actions

Scan the QR code to install the App and get 2 free unlocks

Unlock quizzes for free by uploading documents