The following figure illustrates the action of a HF and F- buffer where the sizes of the boxes are proportional to the concentrations of HF and F- in solution.If you add hydronium until all of the F- is converted into HF and then add a little more hydronium, what is observed? 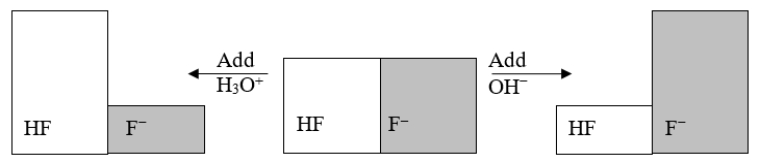
A) The pH increases.
B) The pH decreases.
C) The pH stays the same.
D) The solution will be neutralized.
E) The pH changes, but it is not possible to determine how it will change.
Correct Answer:
Verified
Q50: The neutralization reaction of potassium hydrogen carbonate
Q51: Which of the following statements about bases
Q52: The boxed species in the following reaction
Q53: Each circle is a sample of an
Q54: The boxed species in the following reaction
Q56: What is the role of the kidney
Q57: Which reaction BEST illustrates the reaction of
Q58: What do all bases have in common?
A)
Q59: Each circle is a sample of an
Q60: Which statement BEST describes the following reaction?
Unlock this Answer For Free Now!
View this answer and more for free by performing one of the following actions

Scan the QR code to install the App and get 2 free unlocks

Unlock quizzes for free by uploading documents