The graph below shows the concentrations of B and C inside the cell over time when the cell that has imported B and C in Figure 8.1 above is transferred to a solution containing a much lower concentration of B and C.Based on these data and coupled with the data observed above,substance C is transported via 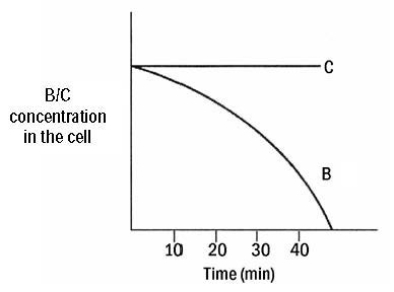
A) active transport.
B) facilitated transport.
C) passive transport.
D) simple diffusion.
E) A,B,and C.
Correct Answer:
Verified
Q26: Which of the following types of ATPase
Q27: Which of the following is true for
Q28: Which type of P-type ATPase would you
Q29: The Na+/K+ ATPase pump actively moves
A)2 Na+
Q30: Each of the following is a characteristic
Q32: All of the following are active transporters
Q33: What specific type of P-type ATPase pumps
Q34: Different ABC transporters can transport
A)ions.
B)sugars.
C)amino acids and
Q35: Mutations in bacterial porins typically lead to
Q36: Although all P-type ATPases use the energy
Unlock this Answer For Free Now!
View this answer and more for free by performing one of the following actions

Scan the QR code to install the App and get 2 free unlocks

Unlock quizzes for free by uploading documents