Examine the figure below.Assume each sugar molecule represents a percentage point of sugar dissolved in the solution.Over time,the solution level on the left side of the figure would ________,while the solution level on the right side of the figure would ________.This is because the solution on the left side of the figure is ________,while the solution on the right side of the figure is ________. 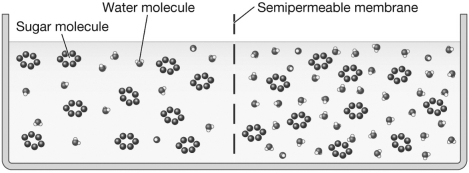
A) rise; decrease; hypertonic; hypotonic
B) decrease; rise; hypertonic; hypotonic
C) decrease; rise; hypotonic; hypertonic
D) There will be no net movement of water because the solutions are isotonic.
Correct Answer:
Verified
Q21: Prokaryotes and eukaryotes are primarily distinguished by
Q22: Which of the following statements MOST accurately
Q22: The smooth endoplasmic reticulum
A) is the site
Q23: An amoeba,a protozoan that moves by pseudopodia,approaches
Q24: A white blood cell (WBC)encounters bacteria in
Q30: Ross buys a bunch of small,round,red radishes
Q31: A protein molecule,transferrin,embedded in the plasma membrane
Q33: A factory with an office that controls
Q34: Ribosomes are very small nonmembranous organelles that
Q35: If a bottle of perfume was spilled
Unlock this Answer For Free Now!
View this answer and more for free by performing one of the following actions

Scan the QR code to install the App and get 2 free unlocks

Unlock quizzes for free by uploading documents