The graph below shows which of the following? 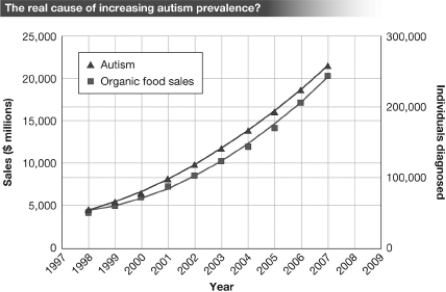
A) There is a strong correlation between the sale/consumption of organic food and the number of individuals diagnosed with autism between 1998 and 2007.
B) The increased consumption of organic food has led to an increase in the rate of autism between 1998 and 2007.
C) Consuming organic food causes autism.
D) There is strong evidence that a cause-effect relationship exists between the consumption of organic food and the development of autism.
Correct Answer:
Verified
Q22: A scientific paper that combines results from
Q23: Rick has high blood pressure and decides
Q24: Observational studies that follow a particular group
Q26: In the fall of 2012,a veterinarian from
Q30: Sue has twin baby boys and is
Q32: The fact that the onset of autism
Q35: If the Centers for Disease Control's recommended
Q37: Which of the following is NOT a
Q38: Although it seems contradictory,real science does not
Q40: Based on the scientific evidence presented in
Unlock this Answer For Free Now!
View this answer and more for free by performing one of the following actions

Scan the QR code to install the App and get 2 free unlocks

Unlock quizzes for free by uploading documents