The figure below,based on data collected by The National Institute of Allergy and Infectious Diseases,graphically illustrates that a disease is less likely to spread to vulnerable members of a population if most of the population is immunized against the disease.This phenomenon occurs because 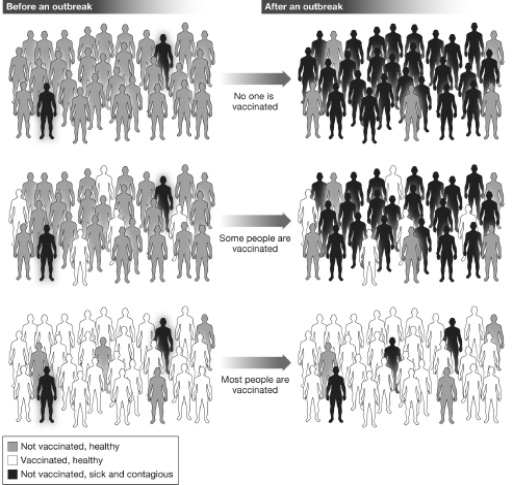
A) when fewer individuals in the population are likely to become infected,fewer people are able to spread the disease,and the vulnerable members of the population are less likely to come in contact with contagious individuals.
B) if more individuals in the population become infected,fewer people are able to spread the disease,and the vulnerable members of the population are less likely to come in contact with contagious individuals.
C) if more individuals in the population become infected,more people are able to spread the disease,and the vulnerable members of the population are less likely to come in contact with contagious individuals.
D) when none of the population is immune to the disease,no one will contract the disease and therefore pass it on to the vulnerable members of the population.
Correct Answer:
Verified
Q25: When Lori was diagnosed with breast cancer,the
Q34: You are reading a paper in the
Q42: The figure below,based on data collected by
Q44: According to the Centers for Disease Control
Q48: Claims that are vague,based on unclearly stated
Q51: If we examine 100,000 children who have
Q52: The MMR vaccine became available in the
Q53: If a statement about how the natural
Q55: Scientific studies that compare patients with a
Q56: A scientist publishes a paper in a
Unlock this Answer For Free Now!
View this answer and more for free by performing one of the following actions

Scan the QR code to install the App and get 2 free unlocks

Unlock quizzes for free by uploading documents