The energy level diagram shown applies to: 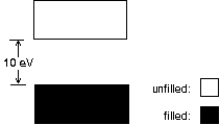
A) a conductor
B) an insulator
C) a semiconductor
D) an isolated atom
E) a free electron gas
Correct Answer:
Verified
Q4: The density of states for a metal
Q9: The Fermi-Dirac probability function P(E)varies between:
A)0 and
Q10: Possible units for the density of states
Q13: Electrons in a full band do not
Q13: The energy level diagram shown applies to:
Q14: We classify solids electrically according to three
Q17: The speed of an electron with energy
Q19: At T = 0 K the probability
Q29: At T = 0 K the probability
Q30: At room temperature, kT is about 0.0259
Unlock this Answer For Free Now!
View this answer and more for free by performing one of the following actions

Scan the QR code to install the App and get 2 free unlocks

Unlock quizzes for free by uploading documents