In the diagram, the function y(t) = ymsin( t) is plotted as a solid curve.The other three curves have the form y(t) = ymsin( t + ) , where is between - /2 and + /2.Rank the curves according to the value of , from the most negative to the most positive. 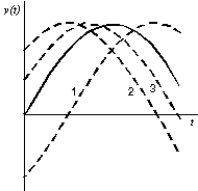
A) 1, 2, 3
B) 2, 3, 1
C) 3, 2, 1
D) 1, 3, 2
E) 2, 1, 3
Correct Answer:
Verified
Q21: The angular frequency of a certain
Q22: An LC circuit has an inductance
Q23: An RLC circuit has a resistance
Q24: At time t = 0 the
Q26: The total energy in an LC
Q27: A 35-
Q32: The rapid exponential decay in just a
Q36: The total energy in an LC circuit
Q38: An LC circuit has a capacitance
Q39: A 35-
Unlock this Answer For Free Now!
View this answer and more for free by performing one of the following actions

Scan the QR code to install the App and get 2 free unlocks

Unlock quizzes for free by uploading documents