The diagram represents the straight line motion of a car.Which of the following statements is true? 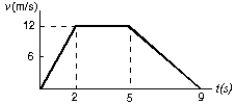
A) The car's speed increases, then it stops, and reverses
B) The car accelerates at 6 m/s2 for the first 2 s
C) The car is moving for a total time of 12 s
D) The car accelerates at -12 m/s2 for the last 4 s
E) The car returns to its starting point when t = 9 s
Correct Answer:
Verified
Q24: A ball rolls up a slope.At the
Q28: A particle moves along the x axis
Q29: Over a short interval near time t
Q31: A car accelerates from rest on a
Q33: The diagram shows a velocity-time graph for
Q34: Each of four particles moves along an
Q35: Throughout a time interval, while the speed
Q38: Which of the following five acceleration versus
Q40: Is it possible for an object to
Q50: A ball is in free fall motion.Upward
Unlock this Answer For Free Now!
View this answer and more for free by performing one of the following actions

Scan the QR code to install the App and get 2 free unlocks

Unlock quizzes for free by uploading documents