Multiple Choice
Figure 10-18 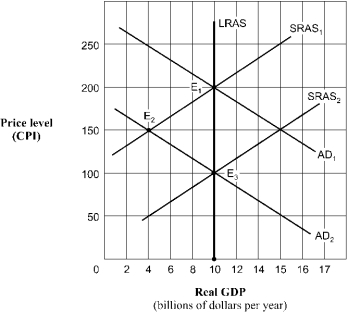
-Given the shift of the aggregate demand curve from AD1 to AD2 in Figure 10-18, the real GDP and price level (CPI) in long-run equilibrium will be
A) $10 billion and 200.
B) $4 billion and 150.
C) $10 billion and 150.
D) $10 billion and 100.
Correct Answer:
Verified
Related Questions

