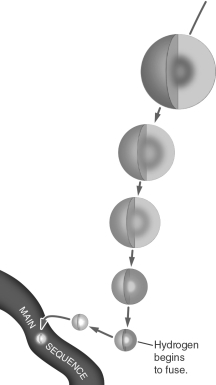
In the figure shown below, the portion of the H-R diagram corresponding to the Hayashi track
of a 1 MSUN star is shown.Temperature increases toward the left, and luminosity increases toward the top of the diagram.Even though the temperature of the protostar is hardly changing as it approaches the main sequence, its luminosity is decreasing.Why? 
Correct Answer:
Verified
View Answer
Unlock this answer now
Get Access to more Verified Answers free of charge
Q82: Why can't very bright protostars be seen
Q83: Why does a protostar continue to collapse
Q84: Some molecular clouds have so much internal
Q85: Why do many stars form from a
Q86: Why can we see dust in the
Q88: At what wavelength(s) are H II regions
Q89: Why do molecular clouds collapse from the
Q90: Describe the general process of how the
Q91: Explain why a star of higher mass
Q92: Why is it possible for self-gravity to
Unlock this Answer For Free Now!
View this answer and more for free by performing one of the following actions

Scan the QR code to install the App and get 2 free unlocks

Unlock quizzes for free by uploading documents