If you measured the distances and recessional velocities for a sample of galaxies and plotted the data to get the figure shown below, what value would you derive for the Hubble constant? 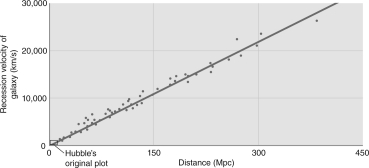
A) 10 km/s/Mpc
B) 50 km/s/Mpc
C) 70 km/s/Mpc
D) 100 km/s/Mpc
E) 500 km/s/Mpc
Correct Answer:
Verified
Q34: In the figure below, three identical photons
Q35: If the slope of the graph v
Q36: Hubble originally estimated the "Hubble constant" to
Q37: In the figure below, three identical photons
Q38: The high temperature and density of the
Q40: If the Hubble constant had a value
Q41: The CMB can be regarded as a
Q42: If the wavelength of the background radiation
Q43: In the early 1960s, physicists Penzias and
Q44: What is the correct interpretation of a
Unlock this Answer For Free Now!
View this answer and more for free by performing one of the following actions

Scan the QR code to install the App and get 2 free unlocks

Unlock quizzes for free by uploading documents