Use the figure below to answer the following questions.
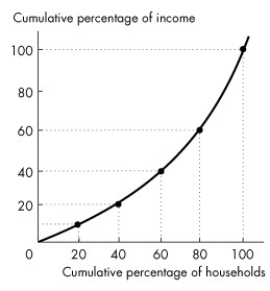
Figure 19.1.3
-In Figure 19.1.3,the second poorest 20 percent of all families receive what share of income?
A) 10 percent
B) 20 percent
C) 30 percent
D) 40 percent
E) none of the above
Correct Answer:
Verified
Q5: Total income equals
A)market income minus payments to
Q10: The closer the Lorenz curve is to
Q17: A Lorenz curve illustrates the distribution of
Q20: In 2009,the mean household income in Canada
Q21: Use the figure below to answer the
Q21: The wealthiest 10 percent of Canadian families
Q26: Use the figure below to answer the
Q28: Which diagram is used by economists to
Q28: Poverty is
A)an income below the national average
Q38: In Canada,the low-income cut-off level for a
Unlock this Answer For Free Now!
View this answer and more for free by performing one of the following actions

Scan the QR code to install the App and get 2 free unlocks

Unlock quizzes for free by uploading documents