Use the figure below to answer the following questions.
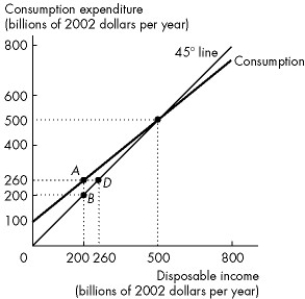
Figure 27.1.1
This figure describes the relationship between consumption expenditure and disposable income for an economy.
-Refer to Figure 27.1.1. Consumption and disposable income are equal
A) at all points along the consumption function.
B) when saving equals $40 billion and disposable income equals $540 billion.
C) when disposable income is $500 billion.
D) when disposable income is $600 billion.
E) when disposable income is greater than or equal to $500 billion.
Correct Answer:
Verified
Q13: The marginal propensity to consume is the
A)fraction
Q14: The marginal propensity to save is calculated
Q15: Use the figure below to answer the
Q16: The marginal propensity to save
A)equals 1 -
Q17: Dissaving occurs when a household
A)spends less than
Q19: If the marginal propensity to save is
Q20: The sum of the marginal propensity to
Q21: Use the table below to answer the
Q22: The consumption function shows the relationship between
Q23: The fraction of a change in disposable
Unlock this Answer For Free Now!
View this answer and more for free by performing one of the following actions

Scan the QR code to install the App and get 2 free unlocks

Unlock quizzes for free by uploading documents