Use the figure below to answer the following questions.
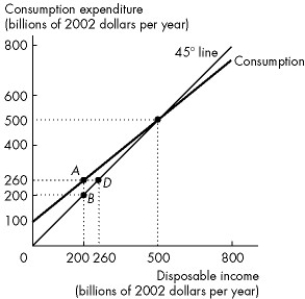
Figure 27.1.1
This figure describes the relationship between consumption expenditure and disposable income for an economy.
-Refer to Figure 27.1.1. When disposable income is $500 billion, saving is equal to
A) disposable income.
B) zero.
C) $20 billion.
D) consumption expenditure.
E) $40 billion.
Correct Answer:
Verified
Q6: When the consumption function lies below the
Q7: The marginal propensity to consume
A)is negative if
Q8: If the marginal propensity to consume is
Q9: Use the figure below to answer the
Q10: The marginal propensity to consume is calculated
Q12: If a household's disposable income increases from
Q13: The marginal propensity to consume is the
A)fraction
Q14: The marginal propensity to save is calculated
Q15: Use the figure below to answer the
Q16: The marginal propensity to save
A)equals 1 -
Unlock this Answer For Free Now!
View this answer and more for free by performing one of the following actions

Scan the QR code to install the App and get 2 free unlocks

Unlock quizzes for free by uploading documents