Use the figure below to answer the following questions.
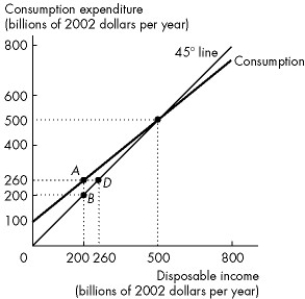
Figure 27.1.1
This figure describes the relationship between consumption expenditure and disposable income for an economy.
-Refer to Figure 27.1.1. When disposable income is equal to $200 billion, saving is
A) zero.
B) $200 billion.
C) $150 billion.
D) $60 billion.
E) - $60 billion.
Correct Answer:
Verified
Q4: Complete the following sentence. A household
A)consumes or
Q5: Use the figure below to answer the
Q6: When the consumption function lies below the
Q7: The marginal propensity to consume
A)is negative if
Q8: If the marginal propensity to consume is
Q10: The marginal propensity to consume is calculated
Q11: Use the figure below to answer the
Q12: If a household's disposable income increases from
Q13: The marginal propensity to consume is the
A)fraction
Q14: The marginal propensity to save is calculated
Unlock this Answer For Free Now!
View this answer and more for free by performing one of the following actions

Scan the QR code to install the App and get 2 free unlocks

Unlock quizzes for free by uploading documents