Use the figure below to answer the following question.
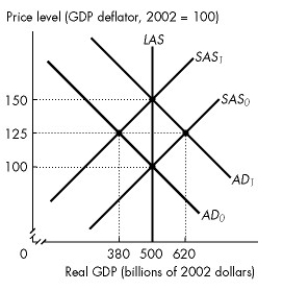
Figure 28.1.1
-Refer to Figure 28.1.1.The figure illustrates an economy initially in equilibrium at the intersection of the SAS? curve and the AD? curve.Which of the following shifts the short-run aggregate supply curve from SAS? to SAS??
A) an increase in the price of oil
B) an increase in the price level
C) an increase in the marginal product of labour
D) an increase in the demand for money
E) a decrease in the money wage rate
Correct Answer:
Verified
Q3: Demand-pull inflation occurs when
A)aggregate demand increases.
B)aggregate supply
Q5: Use the figure below to answer the
Q6: Use the figure below to answer the
Q7: Use the figure below to answer the
Q9: Inflation resulting from an increase in aggregate
Q13: Stagflation occurs when the economy experiences both
A)rising
Q25: Suppose the economy is in long-run equilibrium
Q32: Which of the following would cause the
Q59: Cost-push inflation can result from an initial
A)decrease
Q65: Suppose OPEC unexpectedly collapses, which leads to
Unlock this Answer For Free Now!
View this answer and more for free by performing one of the following actions

Scan the QR code to install the App and get 2 free unlocks

Unlock quizzes for free by uploading documents