Use the figure below to answer the following questions.
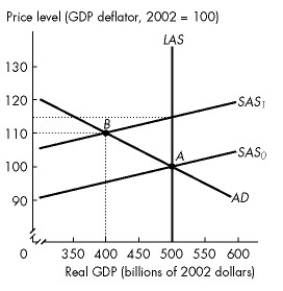
Figure 28.1.2
-Refer to Figure 28.1.2.The vertical distance between SAS? and SAS? represents the
A) actual inflation rate.
B) expected increase in real GDP.
C) actual decrease in real GDP.
D) expected inflation rate.
E) expected decrease in the real wage rate.
Correct Answer:
Verified
Q13: Stagflation occurs when the economy experiences both
A)rising
Q16: Use the figure below to answer the
Q17: Use the figure below to answer the
Q20: Use the figure below to answer the
Q21: Suppose aggregate demand increases by more than
Q47: An economy is in long-run equilibrium when
Q48: An increase in the price level due
Q54: A cost-price inflation spiral results if the
Q55: Stagflation can result from
A)a leftward shift of
Q56: Suppose the quantity of money is expected
Unlock this Answer For Free Now!
View this answer and more for free by performing one of the following actions

Scan the QR code to install the App and get 2 free unlocks

Unlock quizzes for free by uploading documents