Use the figure below to answer the following question.
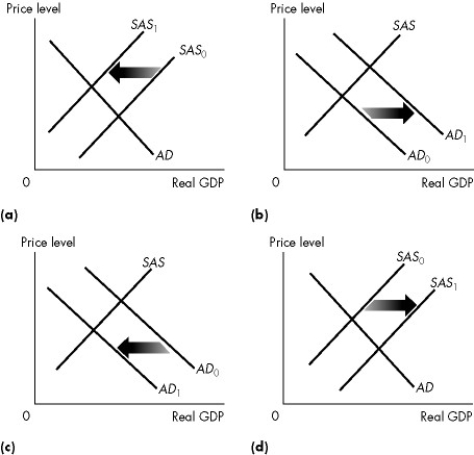
Figure 28.1.5
-Refer to Figure 28.1.5.Which one of the graphs in the figure represents an economy with the price level expected to remain constant?
A) (a)
B) (b)
C) (c)
D) (d)
E) none of the above
Correct Answer:
Verified
Q21: Suppose aggregate demand increases by more than
Q24: Use the figure below to answer the
Q28: The economy starts out at a full-employment
Q29: Use the figure below to answer the
Q30: Use the figure below to answer the
Q47: An economy is in long-run equilibrium when
Q56: Suppose the quantity of money is expected
Q63: Stagflation is the result of
A)a decrease in
Q68: A forecast that is based on all
Q79: A correctly anticipated increase in the quantity
Unlock this Answer For Free Now!
View this answer and more for free by performing one of the following actions

Scan the QR code to install the App and get 2 free unlocks

Unlock quizzes for free by uploading documents