Examine the frequency distribution listed below. The variable is the number of in-service training classes teachers have attended over a two-year period. This frequency distribution is an example of: 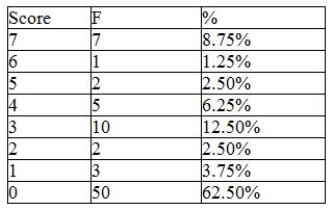
A) descriptive statistics.
B) inferential statistics
C) measures of central tendency
D) a contingency table
Correct Answer:
Verified
Q6: Examine the frequency distribution listed below. The
Q7: Explain the difference between the y-intercept and
Q8: Distinguish between inferential and descriptive statistics.
Q9: Describe and interpret the different measures of
Q10: Explain the impact of skewness on the
Q12: Calculate the range, variance, and standard deviation.
Q13: Explain the difference between a frequency distribution
Q14: A table listing the values of a
Q15: Explain the difference between simple and multiple
Q16: In a grouped frequency distribution, it is
Unlock this Answer For Free Now!
View this answer and more for free by performing one of the following actions

Scan the QR code to install the App and get 2 free unlocks

Unlock quizzes for free by uploading documents