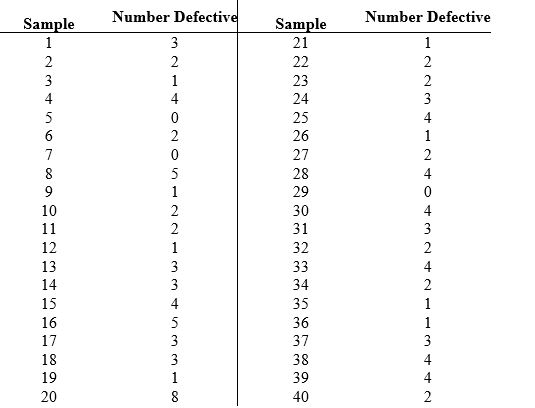
A quality engineer took 40 samples of 100 transistors each from the output of an assembly line.Each transistor was tested and the number of defectives in each sample is recorded in the table below.Determine the control chart limits for a p-chart.
Correct Answer:
Verified
Q92: Construct a flow chart that illustrates the
Q93: Identify the tradeoffs associated with the s-chart
Q94: RM Industries wishes to monitor its end-of-week
Q95: In an attempt to solve the problem
Q96: In the production of vitamin capsules,the
Q98: What were some of the errors that
Q99: How was the problem with the third
Q100: What were the upper and lower specification
Q101: How was the
Q102: What did the statistical consultants recommend to
Unlock this Answer For Free Now!
View this answer and more for free by performing one of the following actions

Scan the QR code to install the App and get 2 free unlocks

Unlock quizzes for free by uploading documents