The graph in the figure shows the variation of the electric potential V (measured in volts) as a function of the radial direction r (measured in meters) . For which range or value of r is the magnitude of the electric field the largest? 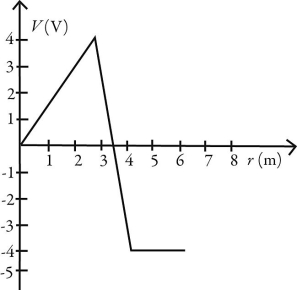
A) from r = 0 m to r = 3 m
B) from r = 3 m to r = 4 m
C) from r = 4 m to r = 6 m
D) at r = 3 m
E) at r = 4 m
Correct Answer:
Verified
Q1: A nonconducting sphere contains positive charge distributed
Q4: The four identical capacitors in the circuit
Q5: An ideal air-filled parallel-plate capacitor has round
Q6: The charge on the square plates of
Q9: A conducting sphere contains positive charge distributed
Q10: In the circuit shown in the figure,
Q13: Equal but opposite charges Q are placed
Q13: A conducting sphere of radius R carries
Q14: The electric field between square the plates
Q16: An ideal parallel-plate capacitor consists of a
Unlock this Answer For Free Now!
View this answer and more for free by performing one of the following actions

Scan the QR code to install the App and get 2 free unlocks

Unlock quizzes for free by uploading documents