The graph in the figure shows the variation of the electric potential V(x) (in arbitrary units) as a function of the position x (also in arbitrary units) . Which of the choices below correctly describes the orientation of the x-component of the electric field along the x-axis? 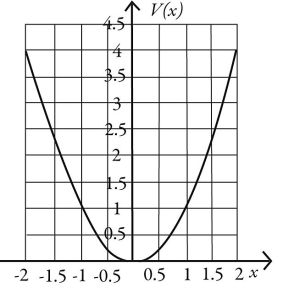
A) Ex is positive from x = -2 to x = 2.
B) Ex is positive from x = -2 to x = 0, and negative from x = 0 to x = 2.
C) Ex is negative from x = -2 to x = 0, and positive from x = 0 to x = 2.
D) Ex is negative from x = -2 to x = 2.
Correct Answer:
Verified
Q12: When two or more capacitors are connected
Q16: The potential as a function of position
Q17: An ideal air-filled parallel-plate capacitor has round
Q17: A metallic sphere of radius 5 cm
Q19: An ideal air-filled parallel-plate capacitor has round
Q21: Three capacitors are connected as shown in
Q23: The capacitive network shown in the figure
Q25: Five capacitors are connected across a potential
Q46: In a certain region,the electric potential due
Q52: In a certain region,the electric potential due
Unlock this Answer For Free Now!
View this answer and more for free by performing one of the following actions

Scan the QR code to install the App and get 2 free unlocks

Unlock quizzes for free by uploading documents