The graph in the figure shows the force on an object as a function of the elongation caused by that force. Which statement about this object is true? 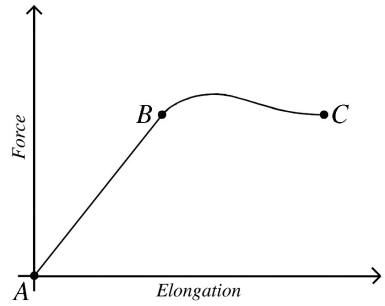
A) The object obeys Hooke's law at all points from A to C.
B) The object obeys Hooke's law at all points from B to C.
C) The object obeys Hooke's law at all points from A to B.
D) The elastic limit occurs at point C.
E) The region of elastic behavior occurs from B to C.
Correct Answer:
Verified
Q4: At a certain depth in the ocean,the
Q12: When you blow some air above the
Q14: If you double the pressure on the
Q15: One of the dangers of tornados and
Q16: Two compressible solids are formed into spheres
Q21: A steel lift column in a service
Q23: A 1000-kg object hangs from the lower
Q34: When the pressure applied to an unknown
Q35: At a depth of about 1030 m
Q36: A very light 1.00-m wire consists of
Unlock this Answer For Free Now!
View this answer and more for free by performing one of the following actions

Scan the QR code to install the App and get 2 free unlocks

Unlock quizzes for free by uploading documents