The figure shows the graph of the position x as a function of time for an object moving in the straight line (the x-axis) . Which of the following graphs best describes the velocity along the x-axis as a function of time for this object? 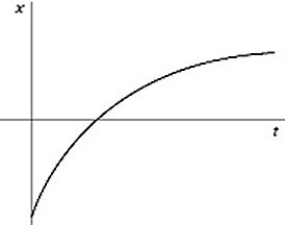
A) 
B) 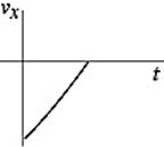
C) 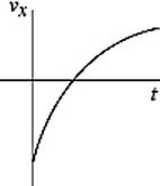
D) 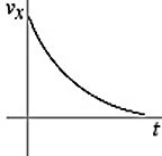
E) 
Correct Answer:
Verified
Q10: The figure shows the position of an
Q11: If the graph of the position as
Q12: The figure represents the velocity of a
Q13: Two objects are thrown from the top
Q13: The motions of a car and a
Q16: The graph in the figure shows the
Q17: An object is moving in a straight
Q18: The motion of a particle is described
Q19: An object starts its motion with a
Q20: Which one of the following graphs could
Unlock this Answer For Free Now!
View this answer and more for free by performing one of the following actions

Scan the QR code to install the App and get 2 free unlocks

Unlock quizzes for free by uploading documents