Figure 27-10 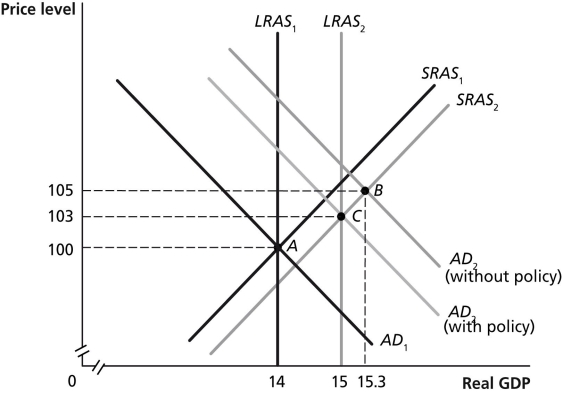
-Refer to Figure 27-10. In the graph above, suppose the economy in Year 1 is at point A and is expected in Year 2 to be at point B. Which of the following policies could Congress and the president use to move the economy to point C?
A) increase income taxes
B) increase government spending
C) buy Treasury bills
D) decrease the discount rate
Correct Answer:
Verified
Q102: What are the key differences between how
Q104: To complement actions by the Fed to
Q109: Table 27-4 Q109: Expansionary fiscal policy _ the price level Q111: Table 27-2 Q111: An appropriate fiscal policy response when aggregate Q114: Which of the following would be most Unlock this Answer For Free Now! View this answer and more for free by performing one of the following actions Scan the QR code to install the App and get 2 free unlocks Unlock quizzes for free by uploading documents
![]()
![]()

