Figure 27-11 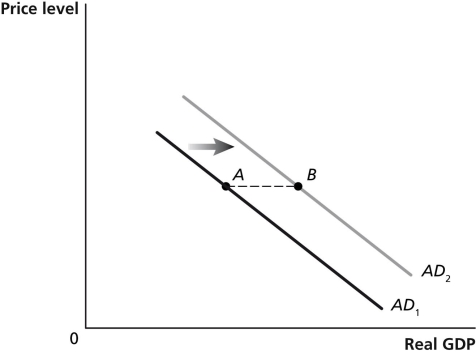
-Refer to Figure 27-11. In the graph above, the shift from AD1 to AD2 represents the total change in aggregate demand. If government purchases increased by $50 billion, then the distance from point A to point B ________ $50 billion.
A) would be equal to
B) would be greater than
C) would be less than
D) may be greater than or less than
Correct Answer:
Verified
Q118: An appropriate fiscal policy response when aggregate
Q118: Figure 27-8 Q119: Table 27-3 Q120: What are the key differences between how Q122: The multiplier effect refers to the series Unlock this Answer For Free Now! View this answer and more for free by performing one of the following actions Scan the QR code to install the App and get 2 free unlocks Unlock quizzes for free by uploading documents![]()
![]()

