Figure 26-2 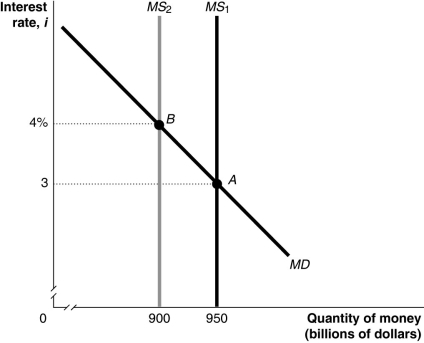
-Refer to Figure 26-2. In the figure above, the movement from point A to point B in the money market would be caused by
A) an increase in the price level.
B) a decrease in real GDP.
C) an open market sale of Treasury securities by the Federal Reserve.
D) a decrease in the required reserve ratio by the Federal Reserve.
Correct Answer:
Verified
Q46: The money demand curve,with the interest rate
Q48: The money demand curve has a negative
Q50: When the price of a financial asset
Q52: For purposes of monetary policy,the Federal Reserve
Q54: If the Fed raises the interest rate,this
Q56: The Fed's two main monetary policy targets
Unlock this Answer For Free Now!
View this answer and more for free by performing one of the following actions

Scan the QR code to install the App and get 2 free unlocks

Unlock quizzes for free by uploading documents