Figure 26-10 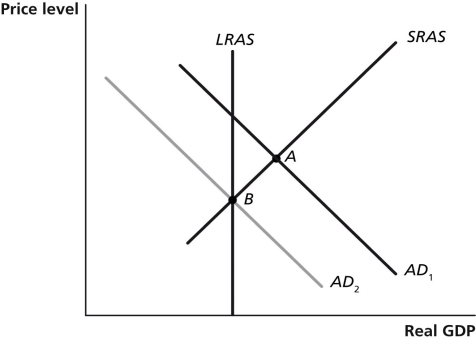
-Refer to Figure 26-10. In the figure above, suppose the economy is initially at point A. The movement of the economy to point B as shown in the graph illustrates the effect of which of the following policy actions by the Federal Reserve?
A) an increase in income taxes
B) a decrease in the required reserve ratio
C) an open market purchase of Treasury bills
D) an open market sale of Treasury bills
Correct Answer:
Verified
Q129: When the Fed embarked on a policy
Q134: If the Fed's policy is contractionary,it will
A)use
Q136: Figure 26-8 Q136: Suppose that the economy is producing below Q137: Article Summary Q137: If money demand is extremely sensitive to Q138: The Fed Q143: If the Fed orders an expansionary monetary Q143: Figure 26-11 Q156: When calculating GDP,the Bureau of Economic Analysis![]()
With global borrowing costs so low,
A)always engages in countercyclical policy.
B)always intends![]()
Unlock this Answer For Free Now!
View this answer and more for free by performing one of the following actions

Scan the QR code to install the App and get 2 free unlocks

Unlock quizzes for free by uploading documents