Figure 21-2 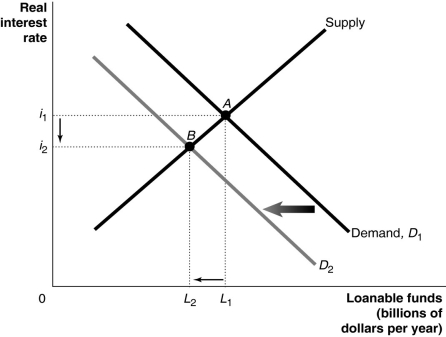
-Refer to Figure 21-2. Which of the following is consistent with the graph depicted above?
A) An expected expansion increases the profitability of new investment.
B) The government runs a budget surplus.
C) Investment spending is declining due to crowding out.
D) New government regulations decrease the profitability of new investment.
Correct Answer:
Verified
Q103: If consumers decide to be more frugal
Q105: A government budget surplus from reduced government
Q106: In comparison to a government that runs
Q107: If Ebenezer Scrooge spends rather than saves
Unlock this Answer For Free Now!
View this answer and more for free by performing one of the following actions

Scan the QR code to install the App and get 2 free unlocks

Unlock quizzes for free by uploading documents