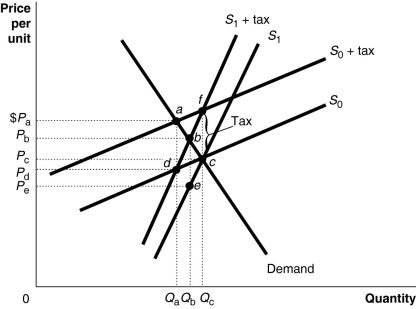
Figure 18-2  Figure 18-2 shows a demand curve and two sets of supply curves, one set more elastic than the other.
-Refer to Figure 18-2. If the government imposes an excise tax of $1.00 on every unit sold, the consumer's burden of the tax
A) is greater under the more elastic supply curve S0.
B) is greater under the less elastic supply curve S0.
C) is greater under the less elastic supply curve S1.
D) is the same under either supply curve because there is a single demand curve that captures buyers' market behavior.
Correct Answer:
Verified
Q150: If you pay $3,000 in taxes on
Q155: In 2016, which type of tax raised
Q160: Last year, Anthony Millanti earned exactly $30,000
Q162: Figure 18-2 Q164: Figure 18-2 Q166: Figure 18-2 Q167: Figure 18-1 Q170: Figure 18-1 Q176: The term tax incidence refers to Q180: Figure 18-1 Unlock this Answer For Free Now! View this answer and more for free by performing one of the following actions Scan the QR code to install the App and get 2 free unlocks Unlock quizzes for free by uploading documents![]()
![]()
![]()
![]()
![]()
A)the degree
![]()

