Figure 15-15 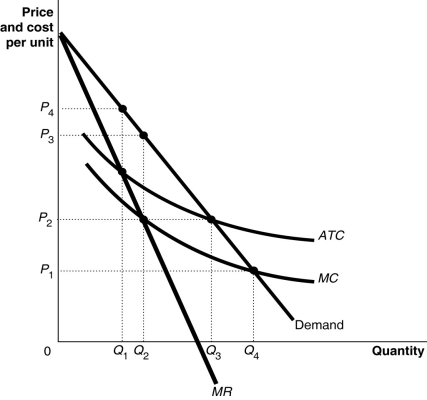 Figure 15-15 shows the cost and demand curves for the Erickson Power Company.
-Refer to Figure 15-15. What is the economically efficient output level and what is the price at that level?
A) Q4, P1
B) Q3, P2
C) Q2, P2
D) Q2, P3
Correct Answer:
Verified
Q209: How do the price and quantity of
Q212: The Federal Trade Commission (FTC)Act
A)gave the FTC
Q213: Figure 15-13 Q223: The U.S.Congress has given two government entities Q225: Figure 15-15 Q227: The Clayton Act is an antitrust law Q228: Figure 15-15 Q230: In regulating a natural monopoly, the price Q237: Figure 15-15 Q239: Article Summary Unlock this Answer For Free Now! View this answer and more for free by performing one of the following actions Scan the QR code to install the App and get 2 free unlocks Unlock quizzes for free by uploading documents
![]()
![]()
![]()
![]()
In late 2017, informed sources announced

