Figure 12-17 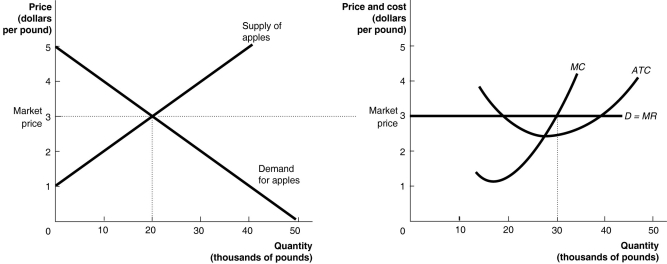 The graphs in Figure 12-17 represent the perfectly competitive market demand and supply curves for the apple industry and demand and cost curves for a typical firm in the industry.
-Refer to Figure 12-17. Which of the following statements is true?
A) The firm will produce 30 thousand pounds of apples in the short run and earn an economic profit. New firms will enter the market and shift the market supply curve to the left.
B) The firm will produce 30 thousand pounds of apples in the short run and earn an economic profit, but it would earn a greater profit if it produced at the lowest point on the ATC curve.
C) The firm will produce 30 thousand pounds of apples in the short run and earn an economic profit. New firms will enter the industry; as a result, the firm will be forced to exit the industry in the long run.
D) The firm will produce 30 thousands pounds of apples in the short run and earn an economic profit. In the long run the firm will break even.
Correct Answer:
Verified
Q201: After an increase in demand in a
Q222: The long-run supply curve for a perfectly
Q229: Figure 12-16 Q230: In a perfectly competitive industry, in the Q234: A constant-cost, perfectly competitive market is in Q240: A perfectly competitive wheat farmer in a Q242: If a firm in a perfectly competitive Q243: Suppose there are economies of scale in Q247: A firm would decide to shut down Q255: Competition has driven the economic profits in
![]()
Unlock this Answer For Free Now!
View this answer and more for free by performing one of the following actions

Scan the QR code to install the App and get 2 free unlocks

Unlock quizzes for free by uploading documents