Figure 12-17 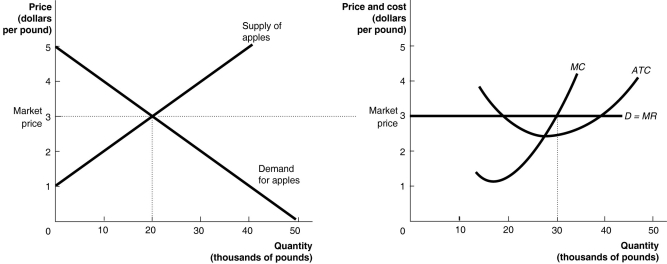 The graphs in Figure 12-17 represent the perfectly competitive market demand and supply curves for the apple industry and demand and cost curves for a typical firm in the industry.
-Refer to Figure 12-17. The graphs depicts a short-run equilibrium. How will this differ from the long-run equilibrium? (Assume this is a constant-cost industry.)
A) Fewer firms will be in the market in the long run than in the short run.
B) The price will be higher in the long run than in the short run.
C) The market supply curve will be further to the left in the long run than in the short run.
D) The firm's profit will be lower in the long run than in the short run.
Correct Answer:
Verified
Q244: What characteristic of a competitive market has
Q245: In an increasing-cost industry the long-run supply
Q249: If, as a perfectly competitive industry expands,
Q251: If, as a perfectly competitive industry expands,
Q252: A firm could continue to operate for
Q253: A perfectly competitive firm in a constant-cost
Q255: Competition has driven the economic profits in
Q257: In a decreasing-cost industry, the entry of
Q258: Assume that a perfectly competitive market is
Q259: Hogrocket, which developed the Tiny Invaders game
Unlock this Answer For Free Now!
View this answer and more for free by performing one of the following actions

Scan the QR code to install the App and get 2 free unlocks

Unlock quizzes for free by uploading documents