Figure 6-12 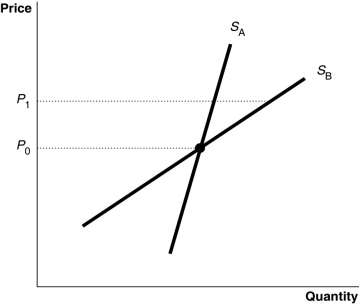
-Refer to Figure 6-12. The diagram shows two supply curves, SA and SB. As price rises from P0 to P1, which supply curve is more elastic?
A) SA
B) SB
C) They are equally inelastic.
D) They are equally elastic.
Correct Answer:
Verified
Q241: Suppose the value of the price elasticity
Q245: Figure 6-10 Q254: Figure 6-11 Q268: To calculate the price elasticity of supply, Q270: Which of the following is a key Q275: If a supply curve is a horizontal Q276: Suppose the demand curve for a product Q277: The price elasticity of supply measures Q278: If an 8 percent decrease in the Q280: If the quantity of walkie-talkies supplied increases
![]()
![]()
A)the responsiveness
Unlock this Answer For Free Now!
View this answer and more for free by performing one of the following actions

Scan the QR code to install the App and get 2 free unlocks

Unlock quizzes for free by uploading documents