Multiple Choice
Figure 5-6 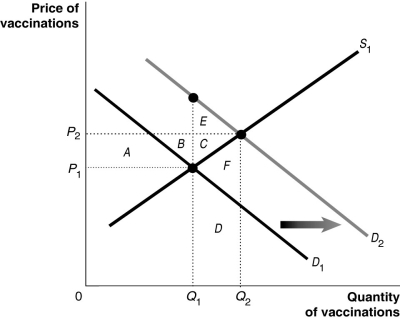 Figure 5-6 shows the market for measles vaccinations, a product whose use generates positive externalities.
-Refer to Figure 5-6. What does D1 represent?
A) the demand curve reflecting social benefits
B) the positive externalities curve
C) the demand curve reflecting private benefits
D) the social welfare curve
Correct Answer:
Verified
Related Questions
Q50: If the social cost of producing a
Q52: When production generates a negative externality, the
Q53: Which of the following could be evidence
Q54: Assume that emissions from electric utilities contribute

