Multiple Choice
Figure 5-6 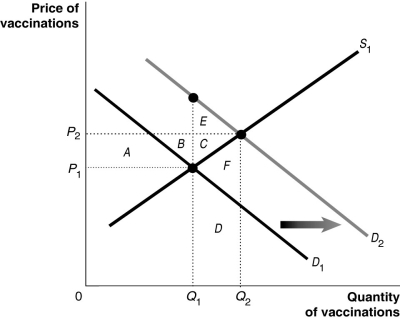 Figure 5-6 shows the market for measles vaccinations, a product whose use generates positive externalities.
-Refer to Figure 5-6. What does D2 represent?
A) the social welfare curve
B) the demand curve reflecting marginal social benefits
C) the demand curve reflecting marginal private benefits
D) the positive externalities curve
Correct Answer:
Verified
Related Questions
Q68: Figure 5-6 Q68: Article Summary Q69: The marginal private cost of a good![]()
According to the online real estate

