Solved

Figure 4-6 Figure 4-6 Shows the Market for Granola

Question 177

Multiple Choice

Figure 4-6 Figure 4-6   Figure 4-6 shows the market for granola. The market is initially in equilibrium at a price of P<sub>1</sub> and a quantity of Q<sub>1</sub>. Now suppose producers decide to cut output to Q<sub>2 </sub>in order to raise the price to P<sub>2.</sub> -Refer to Figure 4-6. What area represents consumer surplus at P<sub>2</sub>? A)  A B)  A + B C)  B + C D)  A + B + D + E 
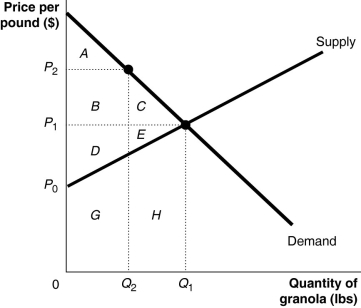
Figure 4-6 shows the market for granola. The market is initially in equilibrium at a price of P1 and a quantity of Q1. Now suppose producers decide to cut output to Q2 in order to raise the price to P2.
-Refer to Figure 4-6. What area represents consumer surplus at P2?


A) A
B) A + B
C) B + C
D) A + B + D + E

Correct Answer:

verifed

Verified

Unlock this answer now
Get Access to more Verified Answers free of charge

Related Questions

Unlock this Answer For Free Now!

View this answer and more for free by performing one of the following actions

qr-code

Scan the QR code to install the App and get 2 free unlocks

upload documents

Unlock quizzes for free by uploading documents